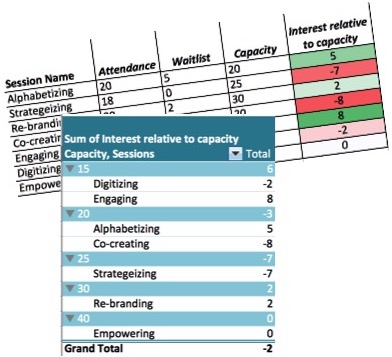
In many projects, I find myself in a room of stakeholders discussing the data. As questions emerge, it becomes evident that they are interested in just-in-time data.
It takes skill as an evaluative leader to guide the discussion through increasingly complex datasets and even more complex interpersonal and power dynamics: being able to utilize and adapt pivot tables, charts, and conditional formatting can inform evidence-based change through engaging data discussions with stakeholders. This workshop is intended for individuals familiar with data entry in typical Excel datasheets with rows and columns.

Through this workshop, you will develop technical practice competencies related to analyzing and interpreting data (new CES competency 2.8) and group facilitation skills related to data discussions (new CES competency 4.5). Recognizing and planning for the use of pivot data tables and charts that auto-update has additional implications for effectively using human, financial and technical resources (new CES competency 4.3).
Session: CES Workshop, Halifax, May 29, 2019
Register via CES conference registration select member or non-member registration and then select Plotting a Dynamic Journey May 29th workshop list www.c2019evaluationcanada.ca
Interested and unable to attend CES, complete the contact me form to be notified of upcoming workshops or to arrange to host a workshop.
About Carolyn Hoessler:
I am passionate about respectful, meaningful, efficient discussions that unlock pathways towards meaningful change and alignment of goals, activities and measures. I bring to our conversation, 12 years experience in facilitating learning, assessment and program development within higher education and beyond. And as a methodological geek, I draw on quantitative, qualitative and mixed method analyses to explore questions of change, contribution, and evidencing value.
Language: English
Learning outcomes:
By the end of this full-day workshop, attendees will be able to:
- Create pivot tables and then adapt them to address additional questions
- Create charts and visuals that auto-update from refreshed pivot tables
- Organize data effectively to create pivot tables with consideration of row identifiers, demographics and the aggregation across rows but not related columns.
o Note: if you have 3 scorers rating the same outcome variable represented as 3 columns, the pivot table will treat each column as a separate variable (and separate column or table). - Conditionally format data and pivot tables based on both colour scales and specified criteria
- Thematically code qualitative data and organize results with a pivot tables to analyze and summarize for both simple coding and multiple codes per quote.
Please note that this session will include demonstrations in a Mac interface. There will also be Windows-based examples and instructions. Hands-on guidance for Windows-based will be provided. To request a Windows-based workshop, complete the contact me form
Subject Matter Expertise: I have facilitated national and international workshops on statistics from a practitioner lens, mentored faculty on qualitative and quantitative analysis in the evaluation of course and program design for over 6 years, and taught graduate courses in statistics, qualitative research methods and mixed methods, I routinely conduct surveys and focus groups with responses from up to 200 students and analyze them in excel for internal reports for program improvement, and work in large-scale datasets.
Facilitation Experience: I have led workshops on teaching and facilitating learning (10+ years), on statistics nationally (CES 2018, ISSOTL 2017, EDC 2011, STLHE 2009) and internationally (ICED 2010), data visualization nationally (STLHE 2018, EDC NJAW 2018) and on evaluation in educational development nationally. I have also taught small group sessions on excel for evaluation project teams.